Pico-8 API Documentation
Graphics
Graphics
Cheatsheet
| function | description |
|---|---|
camera([x, y]) | set camera position |
circ(x, y, r, [col]) | draw circle |
circfill(x, y, r, [col]) | draw filled circle |
clip([x, y, w, h]) | set screen clipping region |
cls([col]) | clear screen; col = clear color |
color(col) | set default color |
cursor(x, y) | set cursor and CR/LF margin position |
fget(n, [f]) | get values of sprite flags |
flip() | flip screen back buffer (30fps) |
fset(n, [f], v) | set values of sprite flags |
line(x0, y0, x1, y1, [col]) | draw line |
tline(x0, y0, x1, y1, mx, my, [mdx,] [mdy]) | Draws a textured line between two points, sampling the map for texture data. |
pal(c0, c1, [p]) | switch colour 0 to colour 1; p = 0 = draw palette; p = 1 = screen palette |
palt(col, t) | set transparency for colour to t (bool) |
pget(x, y) | get pixel colour |
print(str, [x, y, [col]]) | print string |
pset(x, y, [col]) | set pixel colour |
rect(x0, y0, x1, y1, [col]) | draw rectangle |
rectfill(x0, y0, x1, y1, [col]) | draw filled rectangle |
sget(x, y) | get spritesheet pixel colour |
spr(n, x, y, [w, h], [flip_x], [flip_y]) | draw sprite |
sset(x, y, [col]) | set spritesheet pixel colour |
sspr(sx, sy, sw, sh, dx, dy, [dw, dh], [flip_x], [flip_y]) | draw texture from spritesheet |
oval(x0 y0 x1 y1 [col]) | Draw an oval that is symmetrical in x and y (an ellipse), with the given bounding rectangle. |
ovalfill(x0 y0 x1 y1 [col]) | Draw an filled oval that is symmetrical in x and y (an ellipse), with the given bounding rectangle. |
fillp(mask) | set fill pattern for circ, circfill, rect, rectfill, pset, and line |
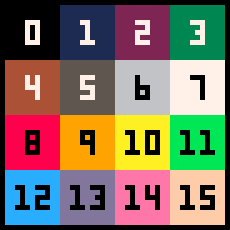
Colors
Documentation
camera()
Sets the camera offset in the draw state.
camera( [x,] [y] )| parameter | description |
|---|---|
x | The x offset, in pixels, to subtract from future draw coordinates. (default 0) |
y | The y offset, in pixels, to subtract from future draw coordinates. (default 0) |
memory
| address | description |
|---|---|
0x5f28 | offset x lo byte |
0x5f29 | offset x hi byte |
0x5f2a | offset y lo byte |
0x5f2b | offset y hi byte |
Setting a camera offset causes all subsequent draw operations to have the offset subtracted from their x and y coordinates. Camera sets the origin point for draw functions, and by default it is (0,0).
The way camera() works is somewhat unintuitive. So, if you might expect to use camera(64,64) to put the camera origin in the middle of the screen, you'd actually use camera(-64,-64) to move the screen so that its middle is in front of the camera. This is probably because camera() sets an screen variable that is invisibly used by all draw functions, and in this case, the origin changed from (0,0) to (-64,-64).
Camera offsets can be used to implement screen effects such as parallax scrolling (with a different offset per layer) or screen shake (a small random offset per frame).
circ()
Draws a circle shape, without fill.
circ( x, y, [r,] [col] )| parameter | description |
|---|---|
x | The x coordinate of the center of the circle. |
y | The y coordinate of the center of the circle. |
r | The radius of the circle, in pixels. If omitted, the radius will be 4. |
col | The color of the circle and fill. If omitted, the color from the draw state is used. |
circfill()
Draws a filled-in circle shape.
circfill( x, y, [r,] [col] )| parameter | description |
|---|---|
x | The x coordinate of the center of the circle. |
y | The y coordinate of the center of the circle. |
r | The radius of the circle, in pixels. If omitted, the radius will be 4. |
col | The color of the circle and fill. If omitted, the color from the draw state is used. |
clip()
Sets the clipping region in the draw state.
clip([x, y, w, h])| parameter | description |
|---|---|
x | The x coordinate of the upper left corner of the clipping rectangle. |
y | The y coordinate of the upper left corner of the clipping rectangle. |
w | The width of the clipping rectangle, in pixels. |
h | The height of the clipping rectangle, in pixels. |
memory
| address | description |
|---|---|
0x5f20 | x_begin |
0x5f21 | y_begin |
0x5f22 | x_end |
0x5f23 | y_end |
When the draw state has a clipping rectangle set, all draw operations will not affect any pixels in the graphics buffer outside of this rectangle. This is useful for reserving parts of the screen
When called without arguments, the function resets the clipping region to be the entire screen and returns the previous state as 4 return values x, y, w, h (since PICO-8 0.2.0d).
examples
-- set the clipping region to exclude 8 pixels at the top and bottomclip(0, 8, 128, 112)-- these circles are clipped to (0-127,8-119)circfill(10, 10, 8, 8)circfill(10, 118, 8, 8) -- reset the clipping region to full screenclip() -- these circles are not clippedcircfill(40, 10, 8, 7)circfill(40, 118, 8, 7) -- get the current clip rectangle from its memory-mapped addressesclip_x=peek(0x5f20)clip_y=peek(0x5f21)clip_w=peek(0x5f22)-clip_xclip_h=peek(0x5f23)-clip_ycls()
Clears the graphics buffer.
cls( [color] )| parameter | description |
|---|---|
color | A color to use for the background. The default is 0 (black). |
The cls() function clears the graphics buffer, effectively setting every pixel to the color 0. If the color argument is provided, that number is used instead.
cls() also sets the text cursor in the draw state to (0, 0).
This ignores the alternate palette set by pal() for the purposes of using color 0. (pal(0, 7) cls() does not fill the screen with white.) To fill the screen with a specific color, use rectfill.
It is common (though not required) to call cls() at the beginning of the _draw() function as part of the game loop.
color()
Sets the draw color in the draw state.
color( [col] )| parameter | description |
|---|---|
col | The color number. Default is 6 (light gray). |
memory
| address | description |
|---|---|
0x5f25 | current pen color. |
Many graphics functions accept an optional color argument. When this argument is omitted, the current color of the draw state is used by default. The color() function sets this color.
The color number corresponds to the PICO-8 palette, a value between 0 and 15. See Graphics for an illustrated table of colors.
When you provide an explicit color argument to a graphics function, PICO-8 changes the draw color to that color.
The color() function honors the alternate palette set by pal().
The previous color is returned when calling color(), allowing it to be saved and restored if needed.
examples
cls() color(7) -- whitecircfill(20, 20, 10)circfill(60, 60, 10) color(8) -- redcircfill(20, 60, 10)circfill(60, 20, 10) pal(7, 10) -- white -> yellowcolor(7)circfill(20, 100, 10)circfill(60, 100, 10) -- get the current color from its memory-mapped addresscur_color=peek(0x5f25)cursor()
Sets the left-margin cursor position for print().
cursor( [x,] [y,] [col] )| parameter | description |
|---|---|
x | The x coordinate of the upper left corner of the line. The default is 0. |
y | The y coordinate of the upper left corner of the line. The default is 0. |
col | (Optional) The palette index to set the pen color to. |
memory
| address | description |
|---|---|
0x5f26 | cursor x position |
0x5f27 | cursor y position |
0x5f25 | pen color (see color()) |
The draw state maintains a cursor location (and a pen color) for printing text with the print() function. PICO-8 uses this to maintain a scrolling display, especially for the command prompt.
The coordinates passed in set the starting location of the next print() call as well as setting the left margin for all subsequent calls.
See print() for a more detailed explanation of the text cursor's behavior.
examples
-- set the cursor position to (20, 24).cursor(20, 24) print("line one")fget()
Gets the value of a flag of a sprite.
fget( n, [f] )| parameter | description |
|---|---|
n | The sprite number. |
f | The flag index (0-7). If omitted, a bit field of all flags is returned. |
Each sprite has eight flags that can be set in the sprite editor or by the fset() function. You can use these flags for any purpose. One possible purpose is to define "layers" of map tiles, which modifies the behavior of the map() function.
Flags are numbered from 0 to 7, appearing left to right in the sprite editor.
When fget() is called without a flag index, it returns a number that represents all of the flags. This is a bit field where flag 0 is the "least significant" bit: flag 0 (leftmost) has a value of 1, flag 1 has a value of 2, flag 2 has a value of 4, and so on, up to flag 7 with a value of 128.
examples
first = fget(16, 0) -- truesecond = fget(16, 1) -- truethird = fget(16, 2) -- falseeighth = fget(16, 7) -- true flags = fget(16) -- 131 (1 + 2 + 128)fillp()
Sets the fill pattern.
fillp( [pat] )| parameter | description |
|---|---|
pat | A bitfield representing the fill pattern to use. |
memory
| address | description |
|---|---|
0x5f31 | pattern lo byte |
0x5f32 | pattern hi byte |
0x5f33 | transparency bit, 1=transparent, 0=opaque |
The fill pattern is part of the draw state. It affects circ(), circfill(), rect(), rectfill(), pset(), and line().
The pattern is a bitfield, a single number that represents a 4x4 pixel pattern. These are the bit values for each pixel in the pattern, in both decimal and hex:
- decimal
-------------------------------| 32768 | 16384 | 8192 | 4096 |-------------------------------| 2048 | 1024 | 512 | 256 |-------------------------------| 128 | 64 | 32 | 16 |-------------------------------| 8 | 4 | 2 | 1 |-------------------------------- hex
-------------------------------------| 0x8000 | 0x4000 | 0x2000 | 0x1000 |-------------------------------------| 0x0800 | 0x0400 | 0x0200 | 0x0100 |-------------------------------------| 0x0080 | 0x0040 | 0x0020 | 0x0010 |-------------------------------------| 0x0008 | 0x0004 | 0x0002 | 0x0001 |-------------------------------------The easiest way to represent this pattern in source code is as a binary number literal:
fillp(0b0011001111001100) -- A checkerboard pattern:-- 0011-- 0011-- 1100-- 1100The default pattern is a solid fill (0b0000000000000000). You can reset the pattern by calling fillp() with no arguments.
The color parameter to the drawing functions (such as circfill()) can set two colors, to be used for the on bits (1's) and off bits (0's) of the pattern. The four lower bits of the color value are the "on" color, and the higher bits are the "off" color. For example, to draw the on bits as light blue (12, or 0xc) and the off bits as dark blue (1), set the color to 0x1c (28).
fillp(0b0011001111001100) -- or 0x33cc.8circfill(60, 60, 10, 0x1c)Alternatively, you can set the pattern to make the off bits transparent (showing what is drawn underneath). To do this, add 0b0.1, or 0x0.8 if using hex, to the pattern value:
rectfill(0, 0, 127, 127, 3)fillp(0b0011001111001100.1) -- or 0x33cc.8circfill(60, 60, 10, 0xc)fset()
Sets the value of a flag of a sprite.
fset( n, [f,] v )| parameter | description |
|---|---|
n | The sprite number. |
f | The flag index (0-7). If omitted, a bit field of all flags is returned. |
v | The value, either true or false if the flag index is specified, or the bit field of all flags if it is not. |
Each sprite has eight flags that can be set in the sprite editor or by the fset() function. You can use these flags for any purpose. One possible purpose is to define "layers" of map tiles, which modifies the behavior of the map() function.
To set a specific flag, specify the flag index as the second argument, and either true or false as the value. Flags are numbered from 0 to 7, appearing left to right in the sprite editor.
When fset() is called without a flag index, it accepts a number that represents all of the flags. This is a bit field where flag 0 is the "least significant" bit: flag 0 (leftmost) has a value of 1, flag 1 has a value of 2, flag 2 has a value of 4, and so on, up to flag 7 with a value of 128.
Setting a flag changes the data in memory, but does not change the cartridge. A program can restore the original data from the cartridge with reload(), and can save the modified data to the cart with cstore(). See Memory for information about the memory addresses to use.
examples
-- Set flag 0 (leftmost) of sprite 16.fset(16, 0, true) -- Clear flag 7 (rightmost) of sprite 16.fset(16, 7, false) -- Set flags 0, 1, and 7 of sprite 16.fset(16, 131) -- 131 = 1 + 2 + 128line()
Draws a line between two points.
line( [x0,] [y0,] [x1,] [y1,] [color] )| parameter | description |
|---|---|
x0 | The x coordinate of the start of the line. If omitted, the x coordinate of the end of the previous line is used, or 0 if no previous line has been drawn. |
y0 | The y coordinate of the start of the line. If omitted, the y coordinate of the end of the previous line is used, or 0 if no previous line has been drawn. |
x1 | The x coordinate of the end of the line. |
y1 | The y coordinate of the end of the line. |
color | The color of the line. If omitted, the color from the draw state is used. This also sets the color in the draw state. |
The line() function is very versatile, with different operations depending on how many arguments are supplied. Line segments, strips, and loops are all easily created with this function.
This is how PICO-8 interprets each possible set of arguments:
line(x0, y0, x1, y1, color)- Draws a line from (x0, y0) to (x1, y1) in the given color. Remembers (x1, y1) as the current endpoint and color as the current pen color.line(x0, y0, x1, y1)- Draws a line from (x0, y0) to (x1, y1) in the current pen color. Remembers (x1, y1) as the current endpoint.line(x1, y1, color)- Draws a line from the current endpoint to (x1, y1) in the given color. If there is no current endpoint, nothing is drawn. Remembers (x1, y1) as the current endpoint and color as the current pen color.line(x1, y1)- Draws a line from the current endpoint to (x1, y1) in the current pen color. If there is no current endpoint, nothing is drawn. Remembers (x1, y1) as the current endpoint.line(color)- Invalidates the current endpoint. Remembers color as the current pen color.line()- Invalidates the current endpoint.
examples
-- draw 20 white lines in random locationscolor(7)for x=1,20 do line(rnd(128), rnd(128), rnd(128), rnd(128))end-- draw a red diamond shape using separate line segmentsline(63, 0, 126, 63, 8) -- this first line sets color to 8/redline(126, 63, 63, 126) -- no need to set color againline(63, 126, 0, 63)line(0, 63, 63, 0)-- draw the same red diamond shape using line continuationline(63, 0, 126, 63, 8)line(63, 126)line(0, 63)line(63, 0)-- draw a regular n-gon using line continuationfunction ngon(x, y, r, n, color) line(color) -- invalidate current endpoint, set color for i=0,n do local angle = i/n line(x + r*cos(angle), y + r*sin(angle)) endendngon(64, 64, 50, 8, 12) -- a blue octagontline()
Draws a textured line between two points, sampling the map for texture data.
tline(x0, y0, x1, y1, mx, my, [mdx,] [mdy])| parameter | description |
|---|---|
x0 | The x coordinate of the start of the line. |
y0 | The y coordinate of the start of the line. |
x1 | The x coordinate of the end of the line. |
y1 | The y coordinate of the end of the line. |
mx | The x coordinate to begin sampling the map, expressed in (fractional) map tiles. |
my | The y coordinate to begin sampling the map, expressed in (fractional) map tiles. |
mdx | The amount to add to mx after each pixel is drawn, expressed in (fractional) map tiles. Default is 1/8 (move right one map pixel). |
mdy | The amount to add to mx after each pixel is drawn, expressed in (fractional) map tiles. Default is 0 (a horizontal line). |
The tline() function draws a line while sampling colors from the map to provide a texture for the line. The mx and my parameters are similar to u,v coordinates used in 3D texture mapping, with the exception that they are expressed in units of map tiles. For example, a coordinate of 4.5,10 would sample from the pixel at 4.58,108 = 36,80 in the map.
The mdx and mdy parameters are effectively the slope of the line being sampled in the map. They can be fractional, they can be negative, and they can be 0. If both are 0, the whole line will sample from the same pixel on the map.
examples
-- Draw 20 textured lines in random locations, -- sampling from the first pixel row of the mapfor x=1,20 do tline(rnd(128), rnd(128), rnd(128), rnd(128))end-- Draw 20 textured lines in random locations, -- sampling from the tenth pixel column of the mapfor x=1,20 do tline(rnd(128), rnd(128), rnd(128), rnd(128), 10/8, 0, 0, 1/8)endpal()
Changes the draw state so all instances of a given color are replaced with a new color.
pal( c0, c1, [p] )| parameter | description |
|---|---|
c0 | The number of the original color to replace. |
c1 | The number of the new color to use instead. |
p | 0 to modify the palette used by draw operations, 1 to modify the palette for the screen already drawn. The default is 0. |
All functions that draw to the screen, including spr() and map(), use the draw palette to decide which colors to write to the graphics buffer. The pal() function can modify this palette at any time to achieve certain effects, such as to temporarily replace a color used by a sprite with another color.
When the graphics buffer is copied to the screen (after _draw() executes or when the program calls flip()), it uses a screen palette. This gives the program another opportunity to replace colors for the entire graphics buffer for full screen effects such as fades, or perhaps very large explosions. You tell the pal() function to modify the screen palette by passing 1 as the optional third argument.
See Graphics for a table of color numbers.
To reset the entire palette, call pal() without arguments. This also resets the transparency settings, as if you had also called palt() with no arguments, so it is not necessary to call both.
pal() is useful for a wide variety of effects. Just a few examples:
- Use different colors with the same sprite to create multiple distinct instances, such as two figures wearing different clothes.
- Embed multiple color patterns in a single sprite then change the palette to cause different patterns to appear for the same sprite, such as multiple kinds of wall tiles using the same sprite.
- Animate color changes in one or more sprites to indicate status, such as a successful hit to an enemy, or a bomb about to explode.
- Change the palette of an entire environment to indicate the time of day.
palt()
Change the transparency of a color in the draw state for subsequent draw calls.
palt( [col,] [t] )| parameter | description |
|---|---|
col | The number of the color to modify. |
t | If true, treat this color as transparent. If false, treat this color as opaque. |
When the spr(), sspr(), and map() functions copy sprite pixels onto the screen, some colors are considered transparent and are not drawn. By default, color 0 (black) is transparent, so when a sprite's pixel is this color and the sprite is drawn on top of an existing image, that pixel preserves the color underneath.
The palt() function changes the transparency of a given color.
If called without arguments, palt() resets the transparency for all colors. The pal() function called without arguments also resets transparency, though the opposite is not true and palt() will not reset colors.
pget()
Gets the color value of a pixel at the given coordinates.
pget( x, y )| parameter | description |
|---|---|
x | The x coordinate. |
y | The y coordinate. |
The pget() function reads the color value of a pixel from the graphics buffer.
It will read from the buffer even if the buffer has not yet been copied to the display.
It will return 0 (black) if given coordinates outside the range (0-127,0-127).
examples
pset(10, 10, 7) -- sets (10, 10) to whiteprint(pget(10, 10), 0, 112, 7) -- prints 7 pset(10, 10, 8) -- sets (10, 10) to redprint(pget(10, 10), 0, 120, 7) -- prints 8 flip() -- displays the red (8) pixel and the messagesprint()
Prints a string of characters to the screen.
print( str, [x,] [y,] [col] )| parameter | description |
|---|---|
str | The string of characters to print. |
x | The x coordinate of the upper left corner to start printing. |
y | The y coordinate of the upper left corner to start printing. |
col | The color to use for the text. |
The print function writes text to the screen using the PICO-8 font.
shorthand
PICO-8 provides a BASIC-like ? shorthand for print().
-- print the player y position to the right of the x position, in green?player.y,32,2,11pset()
Sets a pixel in the graphics buffer.
pset( x, y, [c] )| parameter | description |
|---|---|
x | The x coordinate. |
y | The y coordinate. |
c | The color value. If not specified, uses the current color of the draw state. |
The pset() function sets a pixel in the graphics buffer.
This operation is affected by the draw state.
rect()
Draws an empty rectangle shape.
rect( x0, y0, x1, y1, [col] )| parameter | description |
|---|---|
x0 | The x coordinate of the upper left corner. |
y0 | The y coordinate of the upper left corner. |
x1 | The x coordinate of the lower right corner. |
y1 | The y coordinate of the lower right corner. |
col | The color of the rectangle border. If omitted, the color from the draw state is used. |
This draws a rectangle shape parallel to the screen borders.
It's important to note that the coordinates are inclusive, which is to say PICO-8 will render pixels at the right and bottom coords. In many APIs, x1 and y1 would be the first pixels which are not drawn, but on PICO-8, they are the last pixels which are drawn.
rectfill()
Draws a filled-in rectangle shape.
rectfill( x0, y0, x1, y1, [col] )| parameter | description |
|---|---|
x0 | The x coordinate of the upper left corner. |
y0 | The y coordinate of the upper left corner. |
x1 | The x coordinate of the lower right corner. |
y1 | The y coordinate of the lower right corner. |
col | The color of the rectangle and fill. If omitted, the color from the draw state is used. |
This draws a rectangle shape parallel to the screen borders.
It's important to note that the coordinates are inclusive, which is to say PICO-8 will render pixels at the right and bottom coords. In many APIs, x1 and y1 would be the first pixels which are not drawn, but on PICO-8, they are the last pixels which are drawn.
sget()
Gets the color value of a pixel on the sprite sheet.
sget( x, y )| parameter | description |
|---|---|
x | The x coordinate on the sprite sheet. |
y | The y coordinate on the sprite sheet. |
This is similar to pget() except instead of the graphics buffer, it gets the color value from the sprite sheet. The sprite sheet is treated as a single canvas 128 pixels wide and 128 pixels high.
If the bottom half of the sprite sheet is used for map data, sget will return map data values for that region. Prefer mget() for accessing map data.
It will return 0 (black) if given coordinates outside the range (0-127,0-127).
spr()
Draws a sprite, or a range of sprites, on the screen.
spr( n, x, y, [w,] [h,] [flip_x,] [flip_y] )| parameter | description |
|---|---|
n | The sprite number. When drawing a range of sprites, this is the upper-left corner. |
x | The x coordinate. |
y | The y coordinate. |
w | The width of the range, as a number of sprites. Non-integer values may be used to draw partial sprites. The default is 1.0. |
h | The height of the range, as a number of sprites. Non-integer values may be used to draw partial sprites. The default is 1.0. |
flip_x | If true, the sprite is drawn inverted left to right. The default is false. |
flip_y | If true, the sprite is drawn inverted top to bottom. The default is false. |
sset()
Sets the color value of a pixel on the sprite sheet.
sset( x, y, [c] )| parameter | description |
|---|---|
x | The x coordinate on the sprite sheet. |
y | The y coordinate on the sprite sheet. |
c | The color value to set. If unspecified, the color of the current draw state will be used. |
sspr()
Draws a rectangle of pixels from the sprite sheet, optionally stretching the image to fit a rectangle on the screen.
sspr( sx, sy, sw, sh, dx, dy, [dw,] [dh,] [flip_x,] [flip_y] )| parameter | description |
|---|---|
sx | The x coordinate of the upper left corner of the rectangle in the sprite sheet. |
sy | The y coordinate of the upper left corner of the rectangle in the sprite sheet. |
sw | The width of the rectangle in the sprite sheet, as a number of pixels. |
sh | The height of the rectangle in the sprite sheet, as a number of pixels. |
dx | The x coordinate of the upper left corner of the rectangle area of the screen. |
dy | The y coordinate of the upper left corner of the rectangle area of the screen. |
dw | The width of the rectangle area of the screen. The default is to match the image width (sw). |
dh | The height of the rectangle area of the screen. The default is to match the image height (sh). |
flip_x | If true, the image is drawn inverted left to right. The default is false. |
flip_y | If true, the image is drawn inverted top to bottom. The default is false. |
This operation is affected by the draw state.
Unlike spr(), this function uses pixel locations on the sprite sheet instead of sprite numbers. The sprite sheet is treated as an image 128 pixels wide and 128 pixels high, where (0, 0) is the upper left corner.
If you know the sprite number sp, you can get its coordinates in the sprite sheet (sx, sy) using this formula:
sx, sy = (sp % 16) * 8, (sp \ 16) * 8
This is because the sprite sheet has 16 sprites per row and each sprite is 8x8.
oval()
Draw an oval that is symmetrical in x and y (an ellipse), with the given bounding rectangle
oval(x0 y0 x1 y1 [col])| parameter | description |
|---|---|
x0 | The x coordinate of the upper left corner. |
y0 | The y coordinate of the upper left corner. |
x1 | The x coordinate of the lower right corner. |
y1 | The y coordinate of the lower right corner. |
col | The color value to set. If unspecified, the color of the current draw state will be used. |
ovalfill()
Draw an filled oval that is symmetrical in x and y (an ellipse), with the given bounding rectangle.
ovalfill(x0 y0 x1 y1 [col])| parameter | description |
|---|---|
x0 | The x coordinate of the upper left corner. |
y0 | The y coordinate of the upper left corner. |
x1 | The x coordinate of the lower right corner. |
y1 | The y coordinate of the lower right corner. |
col | The color value to set. If unspecified, the color of the current draw state will be used. |